Data infrastructure at Gojek
At Gojek, we build products that help millions of Indonesians commute, shop, eat and pay, daily. The Data Platform team is responsible to create a reliable data infrastructure across all of Gojek’s 18+ products. In the process of realizing this vision, here are some learnings:
Scale: Data at Gojek doesn’t grow linearly with the business, but exponentially, as people start building new products and logging new activities on top of the growth of the business. We currently see 6 Billion events daily and rising.
Automation: Working on such a large scale makes it important to automate everything from deployment to infrastructure. This way we can push features faster without causing chaos and disruption to the production environment.
Product mindset: The Data Platform team operates as an internal B2B SaaS company. We measure success with business metrics like user adoption, retention, and the revenue, or cost savings generated per feature. And our users are Product Managers, Developers, Data Scientists, and Analysts within Gojek.
Overview
Our data infrastructure lets us publish and consume raw and aggregated data effortlessly and reliably. This unleashes a plethora of possibilities within Gojek. From AI-based allocations, fraud detections, and recommendations, to critical real-time business reporting and monitoring. Given the real-time nature of the business at Gojek, the entire data infrastructure from the ground up focuses on real-time data processing, unlike traditional batch processing architectures. A high-level architecture diagram showing major components of our infrastructure stack:
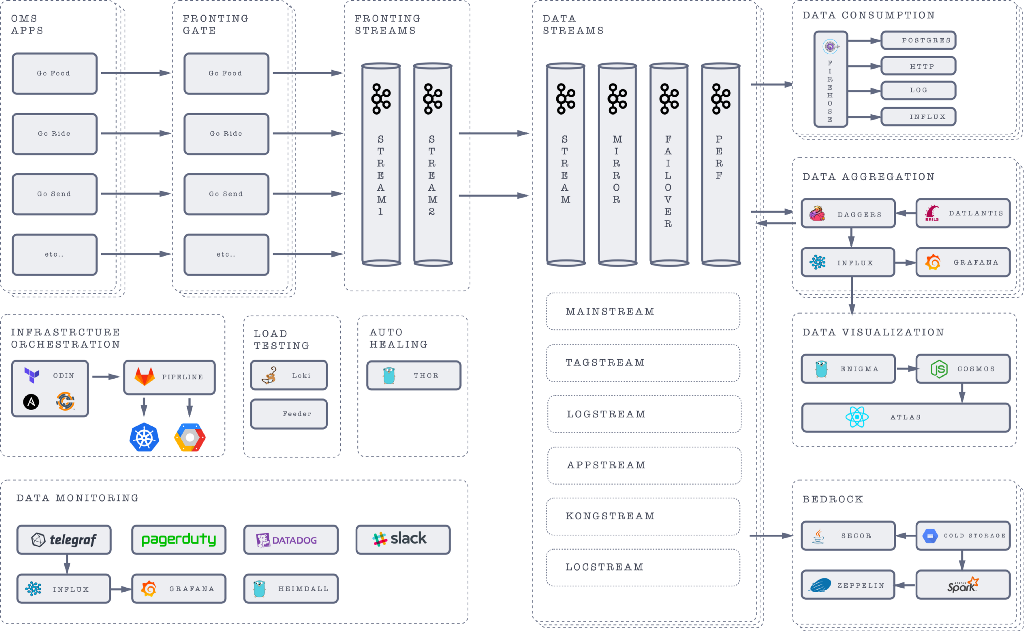
Data Ingestion
Raw data comes into our system from multiple channels. Source code instrumentation sends events through a stream producer library available for different programming languages used at Gojek e.g. Clojure, Jand ava, Ruby, Go. Machine stats daemon runs on compute instances to collect API logs, container logs, statistics, like counters and timers, sent over UDP or TCP.
Stream producers provide publishers with the power to evolve their data schemas without breaking any of the consumers. Data is encoded as protocol buffers, a language-neutral, platform-neutral extensible mechanism for serializing structured data. Producers publish encoded data to fronting servers, particularly suited for high traffic. Each team is allocated one or more highly available fronting servers to avoid any single-point failure and data loss.
Event Streams
- Fronting streams push data to central data streams. Data streams are highly reliable multi-region, rack-aware Kafka clusters.
- We have more than 10 different data streams. Each handles more than a billion points each day. e.g. Locstream- Driver Location stream, Logstream- API Log stream, Tagstream- Segmentation stream, etc.
- A Mirror stream is the mirror of its corresponding data stream with high data retention, purposed for data aggregation and data replays.
- Perf stream is an exact copy of the data stream for chaos engineering and load testing purposes.
- We are also working on making the data stream highly available by having a failover mirror cluster by using cluster service discovery to prevent any downtime.
Data Consumption
Firehose allows the consumption of raw as well as aggregated data without doing anything more than setting up a web application to receive messages.
- Firehose can work in different sink modes. At the moment firehose supports more than 5 sink modes including HTTP, Influx, Postgres, Log, and more.
- Firehose can be easily deployed on VMs — Virtual Machines or Kubernetes clusters.
Data Storage
Data must be retained for business or compliance purposes on a long-term basis, if not indefinitely.
- Secor clusters pull data from data streams to persist messages for long-term storage. We run Secor, distributed across multiple machines. The data is stored in parquet format to cloud storage.
- Zeppelin is a web-based notebook that enables interactive data analytics. We use it for querying data from the apache spark cluster on top of our cold storage.
Data Aggregation
- Dagger is our real-time streaming aggregation and analytics platform powered by Flink.
- To inhibit control and isolation, each team has dedicated dagger clusters, but it comes at the cost of handling a large volume of data replication and maintenance. Currently, we are running more than 10 dagger clusters with increasing demand.
- Datlantis is a user-friendly interface to a fully automated system that creates and deploys custom streaming aggregation on top of Daggers. This allows us to create and deploy massive, production-grade real-time data aggregation pipelines in minutes using SQL-like syntax. The results are written to a time-series database.
Data Visualization
Data is our biggest asset and there’s immense potential in making sense of it. Data viz infrastructure helps us find insights and improves our decision-making.
- Enigma is a metrics query engine to access time-series data with powerful functions to aggregate, filter, and analyze.
- Cosmos is the configuration service that holds mappings of Atlas visualization layers and Dagger metrics. More on this later.
- Atlas is our geo-visualization platform for exploring and visualizing location data sets at scale. Read more about ATLAS here.
Infrastructure automation
- Odin, built on top of Terraform and Ansible/Chef enables us to safely and predictably create, change, and improve infrastructure. It allows us to define infrastructure as code to increase operator productivity and transparency.
- Odin can create clusters, and services, replicate data infrastructure across multiple data centers and manage infrastructure state.
- Odin has helped us reduce provisioning time by 99% despite an increasing number of requests.
Chaos engineering
- Loki is our disaster simulation tool that helps ensure the infrastructure can tolerate random instance failures. Loki can randomly terminate virtual machine instances and containers, exposing engineers to failures more frequently and incentivizing them to build resilient services.
- Loki can also launch feeders and consumers on-demand to load test the new or running clusters.
Infrastructure Monitoring
Infrastructure monitoring is an essential and high-priority job. It provides crucial information that helps us ensure service uptime and optimal performance. We use a wide range of monitoring tools to lets us visualize events and get alerts in real-time including TICK stack, Datadog, and PagerDuty.
We are also working on Heimdall, an internal data tracing service to collect and visualize data and events by data infrastructure. Heimdall builds reporting dashboards for monitoring the state of data collection every day in Gojek.